Visualise CELUM activities in Kibana
The Kibana integration delivers all the information of typical activities from CELUM to the open source analysis platform Kibana, allowing them to be visualised quick and easy.
Use Kibana to visualise your data and navigate the Elastic Stack to get an idea of what requests are being made to CELUM. It provides you with flexible ways to prepare and display your data. It offers all classical views out of the box: Histograms, line charts, pie charts, ring charts and more.
In addition, CELUM workflow events (status-bound) can be visualised with Kibana.
The best practice project is customisable to your specific needs. Developed by brix.
benefits
VISUALISE
Tables, maps and other tools in Kibana are waiting to display your data live.
DIAGRAMS AND TABLES
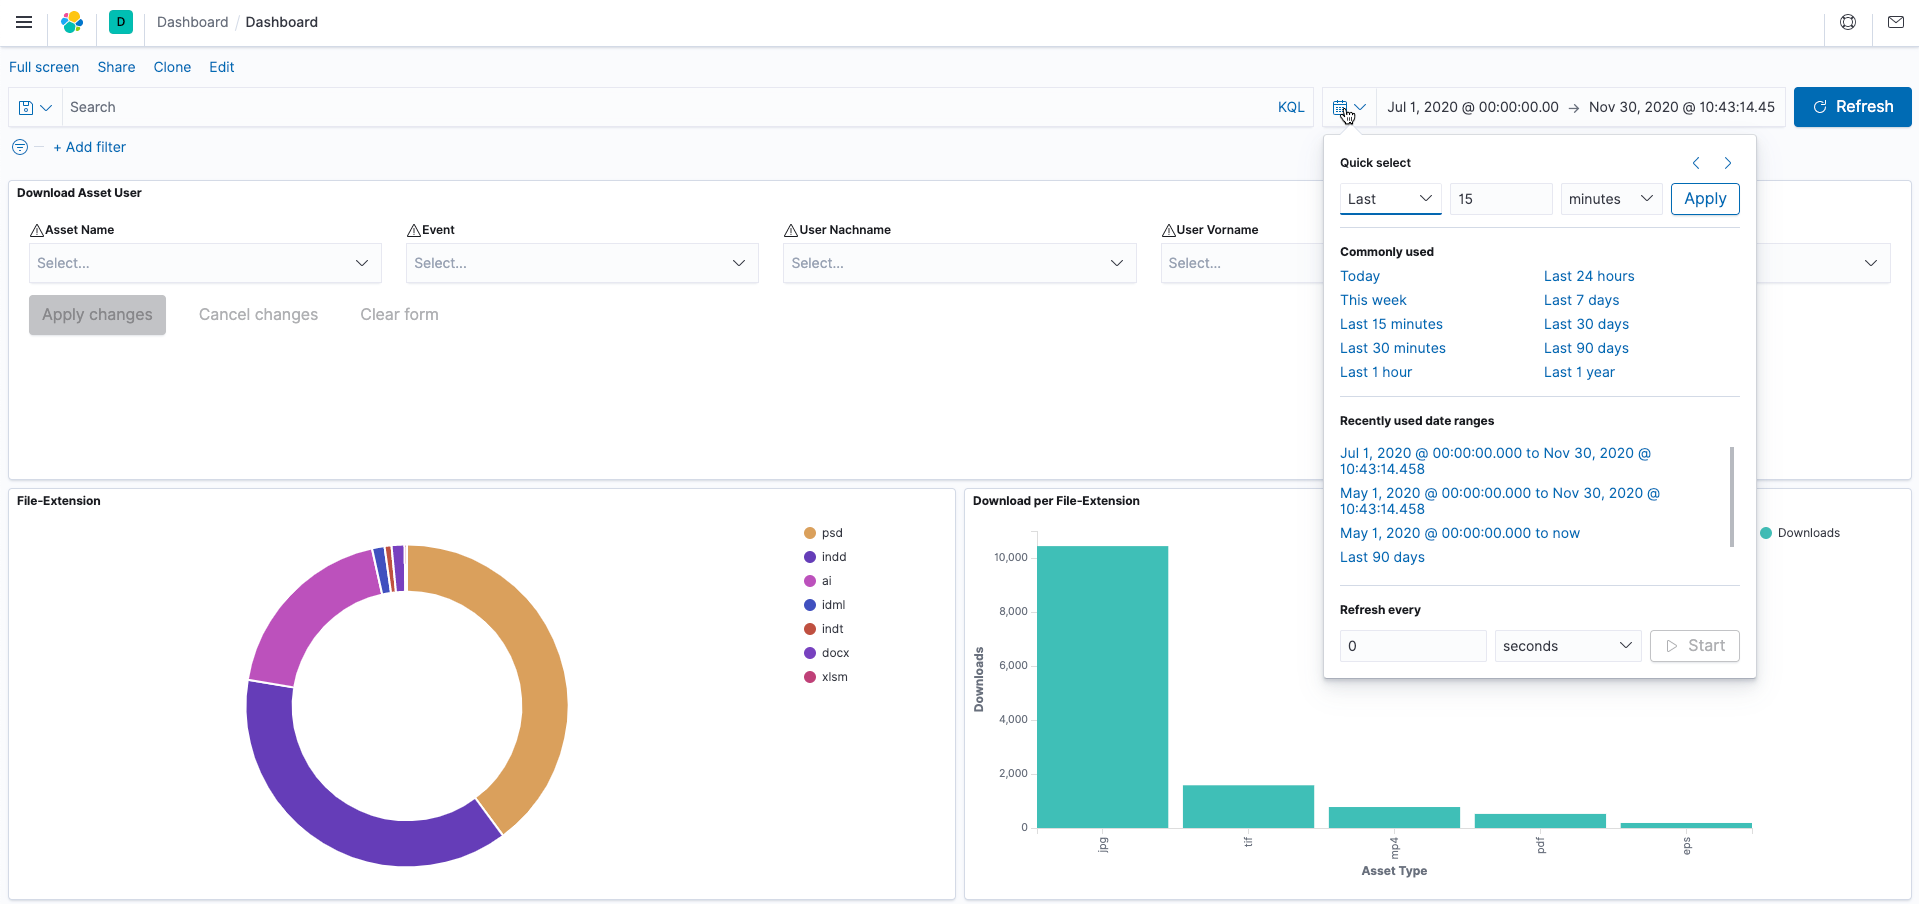
Data diagrams, time diagrams, quantity diagrams, and much more.
DASHBOARDS
Kibana dashboards display a collection of visualisations and searches – target group specific.
DISCOVER
Data discovery features to discover your data.
use cases
SHARE AND COLLABORATE
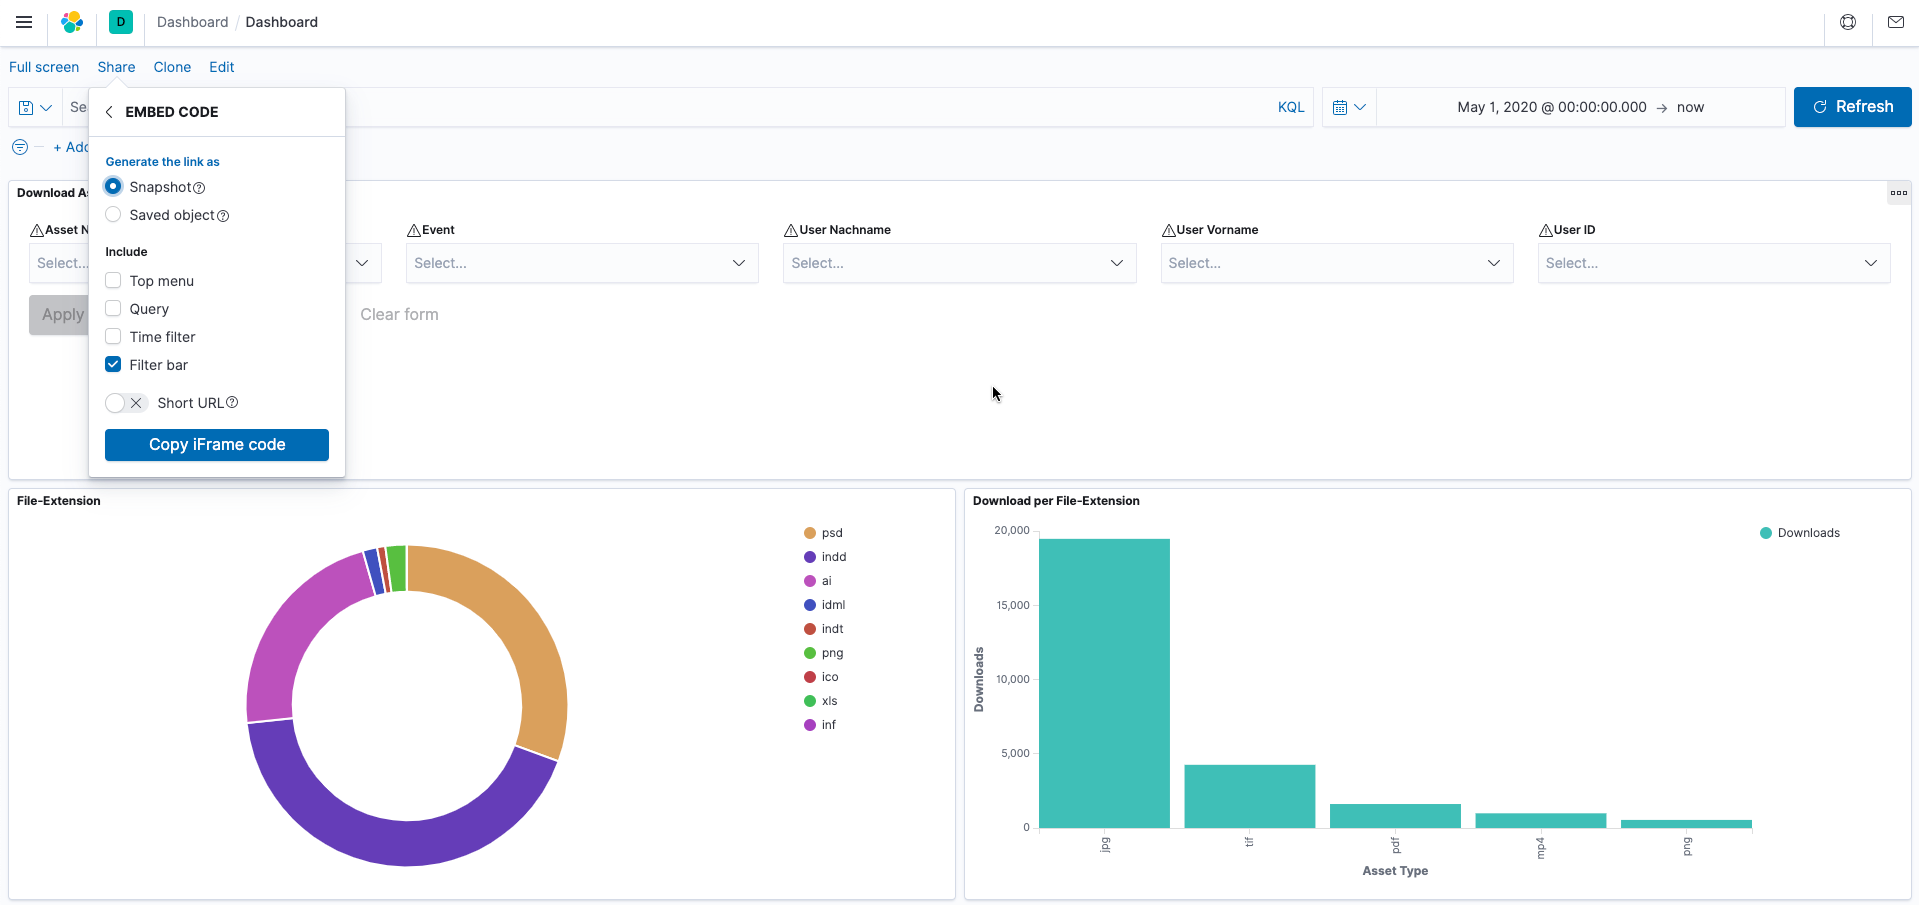
Easily share Kibana visualisations with others in your team – embed a dashboard, share a link or export your data (PDF, PNG, CSV) and send it as an attachment. Organise your dashboards and visualisations within Kibana Spaces.
MACHINE LEARNING
With Elastic Machine Learning, you can automatically model the behavior of your Elasticsearch data – trends, regularity, and more – in real time.
Target group specific creation of Kibana dashboards
Statistical analysis and visualisation of events (such as adding and deleting assets)
Visualise the editing of metadata
Visualise asset usage (uploads and downloads)